Modelling the impact of stormwater management strategies
Version Pdf
Sampada ADHIKARI1,Ricardo ALOMEGOUN1 Kevin VICAL 1 Shahd ELHEGAWY1 Naim GAULT1 (IWS students) Gislain LIPEME KOUYI 2 (researcher),
Article original/Original article: Bonneau, J., Branger, F., Castebrunet, H., & Lipeme Kouyi, G. (2023). The impact of stormwater management strategies on the flow regime of a peri-urban catchment facing urbanisation and climate change: a distributed modelling study in Lyon, France. Urban Water Journal, 20(7), 925–942. https://doi-org.docelec.insa-lyon.fr/10.1080/1573062X.2023.2217809
Institution: 1 Master IWS, EUR H2O’Lyon – Bâtiment CEI 1, 66 boulevard Niels Bohr, Villeurbanne, France
2 INSA Lyon, DEEP, UR7429, Villeurbanne 69621, France
Abstract:
As cities expand and the climate changes, managing stormwater has become a growing challenge. In the western suburbs of Lyon, France, researchers set out to investigate how urbanization and climate change would affect the flow pattern of a peri-urban stream and how green infrastructures could mitigate some undesirable effects.
Using a detailed hydrological model, the team explored how urban development (like covering land with roads and buildings), changes in rainfall patterns (due to climate change), and the use of sustainable urban drainage systems and source control measures such as green roofs, rain gardens, and permeable pavements influence water dynamics at the catchment scale.
Their findings are encouraging but nuanced. Green infrastructures can significantly reduce urban flooding and combined sewer overflows, helping cities to better cope with heavy rains. However, when it comes to the overall flow regime of the stream itself, its impact remains limited, especially under future climate scenarios where droughts and intense precipitations are expected to rise. This is because the stream still receives much of its water from non-urban areas, making it less sensitive to local stormwater management efforts.
The study highlights the value of spatially distributed models in guiding urban planners and water managers. Such tools can estimate how much green infrastructures are needed to fulfil specific management goals and reveal the limits of what “disconnection” strategies alone can achieve.
In short, nature-based solutions strengthen the resilience of urban water systems, but they cannot fully offset the broader effects of climate change. For sustainable water management, they should be part of a larger, integrated strategy that connects urban design, climate adaptation, and the health of local ecosystems.
Key-words: Urbanization; Green Infrastructures; Climate Change; Combined Sewer Overflows; Groundwater Recharge.
I. Introduction
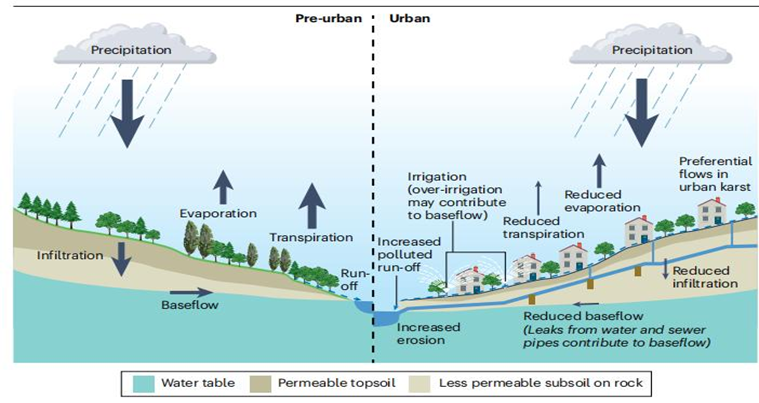
Over the past half-century, cities around the world have expanded at an unprecedented rate. Today, more than half of humanity lives in urban areas, and this rate is expected to keep increasing. As cities spread, natural landscapes give way to concrete and asphalt. Roads, rooftops, and parking lots seal the soil, drastically altering how water moves through the environment. Instead of infiltrating the water through natural soil and recharging aquifers, stormwater now runs rapidly across impervious surfaces, entering into drainage pipes and streams (Burns et al., 2012) increasing peaks, volumes and frequency of streamflow (Sun et al., 2017).
In addition, the ongoing climate change is planned to have some profound consequences on the water cycle and the seasonality of precipitation, inducing some changes in the hydrology of streams. In the South-east of France, where the study is located, most scenarios forecast an increase of the frequency and intensity of droughts and extreme rainfall (Luu et al. 2018; Planton et al. 2008).
Urban streams, once buffered by soils and vegetation, now experience flashier and more extreme flow regimes: stronger floods after storms, longer dry spells between them, and a decline in groundwater recharge. These changes not only heighten the risk of urban flooding and combined sewer overflows but also degrade aquatic ecosystems that depend on stable baseflows and clean water.
Traditionally, cities have relied on “grey infrastructure” which are pipes, sewers, and treatment plants to manage stormwater. While effective in the short term, these engineered systems often shift rather than solve the problem, transferring water (and pollution) downstream. In recent years, however, a new philosophy has emerged: working with nature instead of against it.
Nature-Based Solutions (NBS) or Green Infrastructure mimic natural processes to restore the hydrological balance disrupted by urbanisation (Lafortezza & Sanesi, 2019). Green roofs, rain gardens, infiltration trenches, and porous pavements are designed to retain, infiltrate, and evapotranspire stormwater close to where it falls. These systems can reduce peak flows, limit runoff volumes, improve water quality, and even support biodiversity within urban areas. When deployed at a larger scale, they hold the promise of restoring more natural flow regimes and making cities more resilient to both floods and droughts. However, one crucial question remains: how much green infrastructure is enough to meaningfully influence water dynamics at the watershed level? (Li et al., 2017). And how will future climate scenarios affect the performance of these nature-based systems?
In the western suburbs of Lyon, France, researchers used a physically based hydrological model (J2000P) to explore how a peri-urban stream might respond to two major pressures: urbanisation, climate change and how different levels of stormwater management strategies can mitigate those pressures.
II. Methods and Materials
1. Catchment description
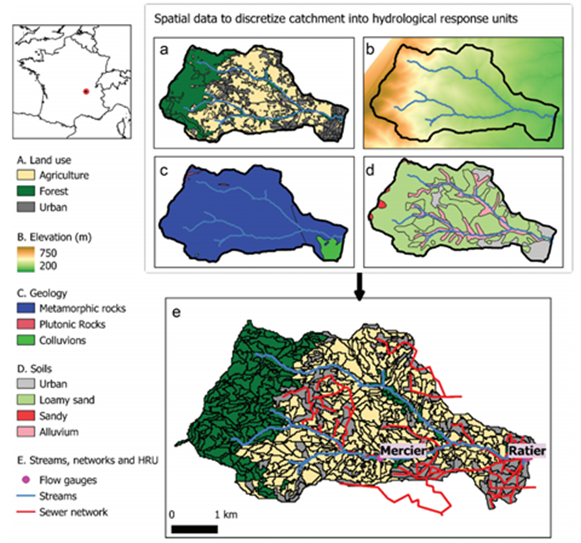
The investigated site is Le ratier stream, which drains a 19 km² peri-urban catchment in the western suburbs of Lyon. This catchment is part of the OTHU’s (observatoire de terrain en hydrologie urbaine) experimental Yzeron catchment, managed by INRAE, and included in the French network of critical zone observatories OZCAR
The catchment exhibits a distinct land-use gradient, where the upper reaches consist of forested hills that give way to a mix of agricultural land (primarily paddocks) and peri-urban development in the middle sections. The lower catchment is characterized by dense residential areas. The area is currently facing a noticeable alteration due to urbanization, resulting in the transformation of farmland to new suburbs and the densification of existing urban zones (Dodane, Joliveau, and Rivière-Honegger 2014).
Concerning the geological aspect of the sub-catchment, it consists of loamy sand and alluvial soils alongside the stream, varying in depth from 1 to 4 meters, with a limited water storage capacity. They lie on a metamorphic bedrock. The height variation of the land in the sub-basin is 720m above sea level as the highest point, and 260m as the lowest. The impervious areas of the catchment were estimated to be approximately 11% of the total area back in 2008 and are drained by a combined sewer network (a system that carries together wastewater from and stormwater to a wastewater treatment plant). Moreover, there are three unmonitored combined sewer overflows (the exit point and the event where this mixture of untreated sewage and stormwater is discharged directly into a nearby river, lake, or ocean) that connect the sewer network and the stream across the catchment. In the scope of this study, rainfall data measured hourly were gathered from different rain gauges ranging from 1997 to 2019. The evapotranspiration is obtained based on atmospheric data, also at an hourly scale within the same range as the rainfall datasets. To create the stream model, hourly flow data were collected for Le Ratier creek from 2012 to 2018. Additionally, Mercier creek, a smaller stream that flows into Le Ratier, data from 2014 to 2018 were utilized to check the model’s accuracy.
2. Description of the hydrological model J2000P
The hydrological modelling of the catchment was performed using the J2000P software that simulates the movement of water across a catchment, from rainfall occurrence, through the soil and underground water, and perhaps into the receiving water. It is called physical-based because it strives to represent natural physical processes (like infiltration, evaporation, and runoff) using equations derived from physics. The J2000P is an updated version of the hydrological model J2000, to incorporate new features such as sewer networks and combined sewer overflow structures (CSOs). The computer-based model works by splitting the catchment into different sections with similar soil type, land use and slope, called hydrological response units (HRUs). When a rainfall event occurs, the model first determines how much water is intercepted by vegetation. Then, it estimates how much runs off the surface. Then it calculates the amount of water that infiltrates into the soil and the quantity that recharges the groundwater aquifer. Water stored in the soil can later evaporate into the atmosphere, be used by plants as an essential nutrient, or flow sideways underground. All these water movements are calculated for each hydrological response unit and then combined to show how water reaches the rivers after rain. The model runs step-by-step in time (hourly) to simulate real conditions. The model is capable of hosting a green infrastructure model, necessary in computing with exactitude the calibrated physics model, as the infrastructure is part of the catchment.
3. Model setup, parametrisation, and calibration
The J2000P model separated the catchment into 490 Hydrological Response Units (HRUs) based on land use, soil, geology and digital elevation datasets. This operation was made possible by a tool called HRU-delin. It creates HRUs by grouping different maps and connecting them based on the topography and the direction of the river flow. Some necessary parameters, like infiltration and percolation rate (which indicate how quickly water moves through soil), were calibrated using observed flow data from 2014 to 2019. Calibration refers to the adjustment of the model’s parameters so that the simulated river flow matches the observed data as much as possible.
To test the performance of the model, statistical indicators like Nash-Sutcliffe Efficiency (NSE) have been used to compare the observed and simulated runoff. Moreover, the groundwater contribution was separated from the total streamflow to evaluate how efficiently the model represented the subsurface water.
The result showed that the model achieved good NSE values, which were around 0.7, indicating that it can be trusted.
Finally, the model was validated using a nearby stream (Le Mercier) for confirmation, to be sure it works well in a similar catchment. The validation step is fundamental because it tests the reliability of the model to simulate another catchment hydrological process. Therefore, applying the calibrated model in a neighboring stream permitted to verify the robustness of the model. The good performance of the model in a new location gives assurance that the parameters used are reliable and increases confidence that it can be used for future prediction scenarios or assess hydrological behavior in other parts of the catchment under various conditions.
4. Creation of future scenarios
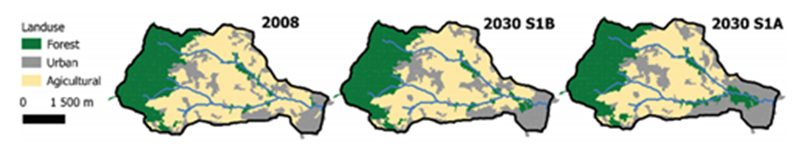
Maps of future land use were obtained from the AvuPur project led by Braud et al., which predicted urbanization scenarios for the year 2030 based on the opinions of experts and discussions with local authorities. Three main maps were utilized: the reference map (2008) and two future maps bringing forth various levels of urban expansion (2030 S1A and 2030 S1B). For each one of them, different gradients of imperviousness (Portion of land covered by concrete, roads, or buildings) were created for additional scenarios. The degree of surface imperviousness ranged from -3.5%, 0%, +3.5%, and 7%, representing both conservative and extreme urban sprawl possibilities. By applying each of the four imperviousness gradients to each of the three base maps, a total of 12 distinct urbanization scenarios were formed. The goal is to explore the effect of different patterns of urban growth on streamflow and future flood events.
Additionally, future rainfall and evapotranspiration were created based on current observed time series data of rainfall and temperature, using the delta-method. Current hourly rainfall were multiplied by monthly coefficients to adjust monthly totals to possible future climate sources and the hourly evapotranspiration was increased by an additional amount, depending on the variation of the projected monthly temperature. This process is important because rainfall and evapotranspiration greatly affect the water cycle. With a rainfall event, there is an addition of water in the catchment and the contrary happens during evapotranspiration. Reproducing their possible future changes helps to predict the effect of climate change on water availability, runoff and floods. Several scenarios were therefore created to represent wetter and drier futures, as well as various degrees of warming (+2 °C, +3.5 °C, and +5 °C).
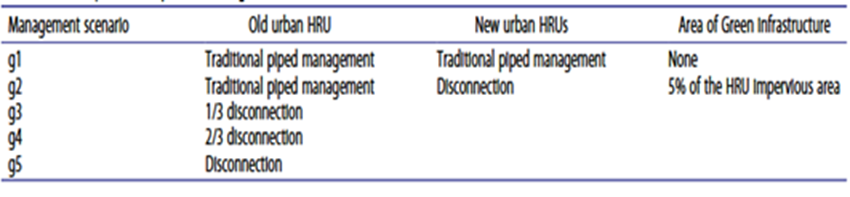
Finally, five stormwater management scenarios were implemented to test the effect of the rise in green infrastructure (GI) under different urbanization and climate conditions. In the reference scenario g1, all the runoff is directly connected to the drainage network without nature-based system. In the Scenarios g2 to g5, the disconnection of impervious surfaces is progressively increased to have a condition where there are more GI zones. Only new urban areas (g2) are totally disconnected, then 1/3 (g3), 2/3 (g4), and finally all (g5) existing impervious areas are disconnected.
5. Simulations overview and hydrological indicators
A total of 640 simulations were computed to understand the effect of the interaction between urban growth, climate change and new stormwater management solutions on the catchment. The study tested different rainfall patterns, city expansion scenarios, and strategies for managing runoff with green infrastructure. The plan was to have an understanding of the separated and combined effects of urbanization, climate change and management strategies on hydrological indicators. This approach reveals which of the factors have the greatest impact on the basin, and which management strategy mitigate effectively the negative impacts.
III. Results
1. Effects of urbanisation and disconnection under a constant climate
In this part we’ll study how different water-related indicators (streamflow, groundwater recharge, and sewer overflows) change when the percentage of impervious surfaces (like roads and roofs) increases, under today’s rainfall and evaporation conditions.
- Streamflow :
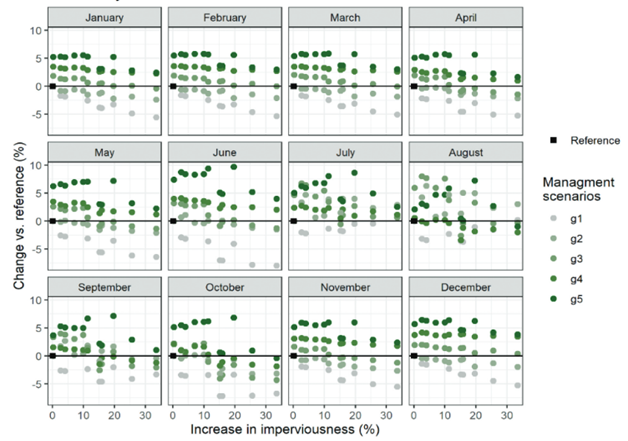
We observe that as cities become more and more urbanized (more impervious surfaces) the streamflow generally decreases. This trend is mostly visible through October to June.
But, we remark that more we add green infrastructure, the average flow in the stream increases, by up to 5% in the g5 scenario (all disconnected) as seen in figure 4.
Also, maximum flows react much more strongly. Without any disconnection strategy, the highest flows between April and September can increase dramatically up to +50% in July and +116% in August compared to the current situation. While adding green infrastructure reduces these peaks significantly, even below current levels in summer months. In the most effective scenario (g5), maximum flows drop by up to 37%.

- Groundwater recharge :
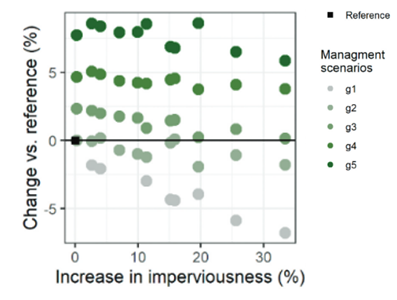
The amount of water that infiltrates and recharges the groundwater decreases as urbanization increases. On average, a 10% rise in imperviousness reduces annual groundwater recharge by about 2.5%.
However, green infrastructure helps compensate for this loss. In the “g3” scenario (disconnecting new urban areas and one-third of existing ones), recharge returns to the reference level. With full disconnection, it even exceeds it.
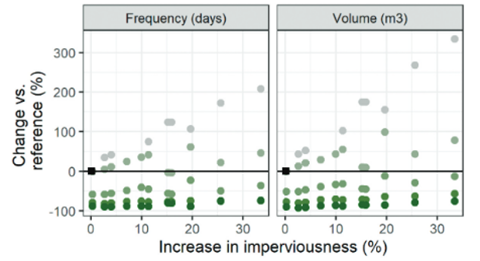
- Combined Sewer Overflows:
Without disconnection, the frequency and volume of sewer overflows rise steeply with urbanization, up to +208% and +334% respectively in the most pessimistic urban scenario. Installing green infrastructure helps a lot: disconnecting just new areas and one-third of existing ones reduces overflow frequency by 47% and volume by 35%. With total disconnection, overflows are almost eliminated (reductions of about 90%).
2. Effects of climate change without new urbanisation
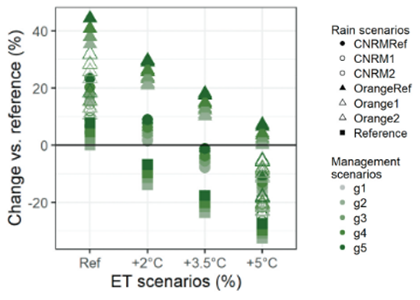
This part shows how average monthly streamflow, groundwater recharge, and CSO volume and frequency change with different rainfall and evapotranspiration (ET) scenarios, assuming no new urban development.
- Streamflow:
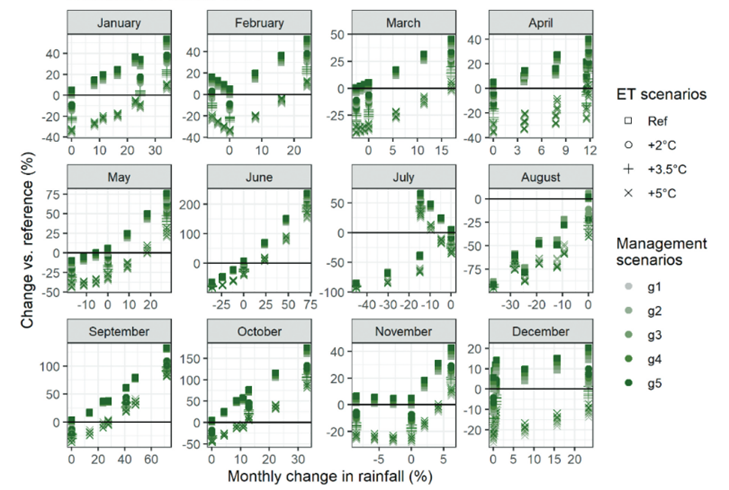
Mean flows change almost linearly with rainfall: more rain means higher flow, and less rain means lower flow. From November to April, flows range between −45% and +53%, depending on whether rainfall decreases or increases.
The response is even stronger in June, September, and October, when variations reach up to +237%.
Maximum flows are even more sensitive to rainfall changes. From November to May, they increase or decrease in the same direction as rainfall, but in June and September, extreme rainfall can cause flows to rise by more than 500%. Conversely, in July and August, peak flows decrease in all cases due to high evapotranspiration.
Although these percentage changes look large, in absolute terms the increases are moderate. Indeed, June flow may rise from 10.5 to 24 L/s. Still, these changes are much larger than those caused by urbanization or disconnection under a constant climate.
This means that rainfall and evapotranspiration changes have a stronger impact on flow than land management strategies.
- Groundwater recharge
Recharge increases when rainfall increases (up to +40%), but decreases when evapotranspiration increases (down to −30%). Compared to climate effects, green infrastructure has only a minor impact on total recharge.
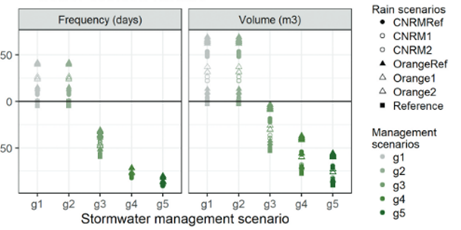
- Combined Sewer Overflows:
Without disconnection, climate change tends to increase CSO frequency and volume (up to +50%).
However, implementing disconnection strategies again helps to mitigate this effect. In fact, from the g3 scenario onward, CSOs are reduced below current levels, and almost disappear in the “all disconnected” case.
3. Combines impacts of climate and urbanization
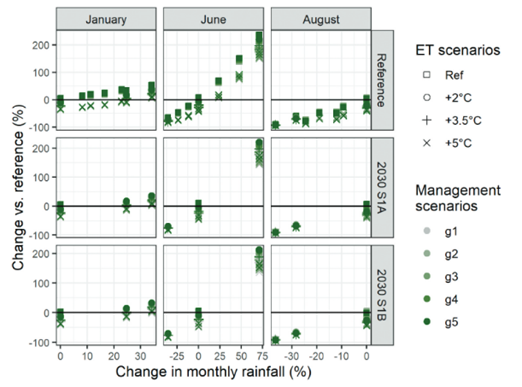
Figure 9 shows the combined effects of climate change, urban sprawl, and green infrastructure for three months (January, June, and August).
Overall, rainfall changes have the largest effect on streamflow, much more than urbanization or disconnection. Stormwater management strategies only slightly influence mean streamflow when compared to rainfall variations.
IV. Discussion
The results of the study show that the main effects of urbanization of the catchment on the river (decrease of mean flow, increase of peak flow and of the pressure on sewer system) can be mitigated by green infrastructure implementations. However, it highlights that, in such low urbanized catchments, climate change still is the major driver for interflows (subsurface flows that circulate through the soils) and mean flows. It can be explained by a low storage capacity of the catchment, and therefore, a predisposition to a quicker total saturation or drought.
Nevertheless, it is important to underline the limitations of the method used in this article. First of all, some features are totally ignored, such as interactions between networks and soil or underground water circulation paths. Moreover, there is a real lack of predictability of the concrete effect of the development of the territory, such as the increase of inhabitants or the extension of drinkable water networks, that can impact the groundwater dynamics (more extraction or on the other hand, more inputs). But besides these two important points, it is crucial to remember that modelling is based on a – sometimes massive – simplification of the dynamics and processes studied. We can cite there the urban spread scenario, that is studied through a unique measure of imperviousness, which doesn’t consider the evolutions of urban planning standards in terms of ground permeability. It is also the case for green infrastructures, all considered homogeneous regardless of the different functions and level of infiltration it can provide. Finally, trying to predict climate change with linear scenario doesn’t allow an unbiased estimation, especially when it comes to talk about extreme events, that occur more often and are getting more intense through the years.
Finally, as shown before, the results of such studies are highly dependent on the geocontext of the catchment studied. The results only stand with this specific area (climate-related flow regime, catchment physical characteristics, urbanization intensity and composition, ….) and cannot be reproduced elsewhere. The conclusion we can draw from the experiment has therefore to be understood as data-driven hypothesis based on a particular case of study, that might lack robustness to be generalized or extended if these base parameters change drastically. However, green infrastructures still appear to be a promising solution for water managers and urban planners to lessen the negative impact of urbanization on water flow.
V. Conclusion
The study focuses on modeling the hydrological behavior of a 19 km² peri-urban catchment located on the outskirts of Lyon. A physically based hydrological model (J2000) is applied to simulate and analyze the catchment responses. The different scenarios are developed on the basis of the parameters like urbanization, climate change, and stormwater management with progressive implementation of green infrastructure. The objective is to quantify the influence of each factor on the future flow regime.
Overall, the results showed that large-scale use of green infrastructure (GI) can help reduce some hydrological impacts of urbanisation, especially by drastic reduction of combined sewer overflows. However, under changing climate conditions, GI did not have much effect on the overall stream flow pattern, especially because the flow regime is mostly influenced by water coming from non-urban areas.
References:
Burns, M.J., T.D. Fletcher, C.J. Walsh, A.R. Ladson, and B.E. Hatt. 2012. “Hydrologic Shortcomings of Conventional Urban Stormwater Management and Opportunities for Reform.” Landscape and Urban Planning 105 (3): 230–240. https://doi.org/10.1016/j.landurbplan.2011.12.012 .
Fletcher, Tim D., Matthew J. Burns, Kathryn L. Russell, et al. « Concepts and Evolution of Urban Hydrology ». Nature Reviews Earth & Environment 5, no 11 (2024): 789‑801
Lafortezza, R., Sanesi, G., 2019. Nature-based solutions: Settling the issue of sustainable urbanization. Environ. Res. 172, 394–398. https://doi.org/10.1016/j.envres.2018.12.063
Li, C., T.D. Fletcher, H.P. Duncan, and M.J. Burns. 2017. “Can Stormwater Control Measures Restore Altered Urban Flow Regimes at the Catchment Scale?” Journal of Hydrology 549: 631–653. https://doi.org/10.1016/j.jhydrol.2017.03.037 .
Luu, L.N., R. Vautard, P. Yiou, G.J. van Oldenborgh, and G. Lenderink. 2018. “Attribution of Extreme Rainfall Events in the South of France Using EURO‐CORDEX Simulations.” Geophysical Research Letters 45 (12): 6242–6250. https://doi.org/10.1029/2018GL077807 .
Planton, S., M. Déqué, F. Chauvin, and L. Terray. 2008. “Expected Impacts of Climate Change on Extreme Climate Events.” Comptes Rendus Geoscience 340 (9–10): 564–574. https://doi.org/10.1016/j.crte.2008.07.009 .
Sun, S., S. Barraud, F. Branger, I. Braud, and H. Castebrunet. 2017. “Urban Hydrologic Trend Analysis Based on Rainfall and Runoff Data Analysis and Conceptual Model Calibration.” Hydrological Processes 31 (6): 1349–1359. https://doi.org/10.1002/hyp.11109
How to cite this article: ADHIKARIA, S., ALOMEGOUN, R., VICAL, K., ELHEGAWY, S., GAULT, N., and LIPEME KOUYI, G.(Villeurbanne, FR), Modelling the impact of stormwater management strategies, DECODER Journal, 2026-03-31