
How to identify and monitor the response of forests near riverbanks to drought: use of aerial thermal imagery and on-field measurements
Julien Godfroy1, Poorva Bhatt2, Helen Cadoret2, Amirreza Ghannad2, Gloria Tshitoko2, Mathis Vignaud2, Bastien Lequay2 and Jan Doleiska2
Article original/Original article : Godfroy, Julien, Pauline Malherbe, Flavie Gerle, et al. « Can Multiscale Thermal Infrared Imaging Help Validate and Monitor Water Stress in Alluvial Forests? » Ecohydrology 18, no 2 (2025): e2710. https://doi.org/10.1002/eco.2710.
Institution:
- 1 Univ. Grenoble Alpes, INRAE, LESSEM, St-Martin d’Hères, France
- 2 Master IWS, EUR H2O’Lyon – Bâtiment CEI 1, 66 boulevard Niels Bohr, Villeurbanne, France
Abstract:
Forests near riverbanks, also known as alluvial forests, are sensitive to drought caused by climate change and worsened by changes in river flow. Being able to find and map this sensitivity is important to understand the effects of climate change and change how we manage these forests. In this study, we tested if thermal infrared images, measuring tree temperature, taken at different spatial scales could be used to diagnose the health of the forest during drought.
In the summer of 2022, we collected leaves and bark from black poplar trees at two sites with different levels of connection to groundwater along the Ain River in France. These samples were analysed to study the seasonality of water stress and to check whether the stress was visible on the thermal infrared images.
To map the forest’s sensitivity to drought, we used thermal data from two sources: (i) airborne campaigns where thermal cameras were mounted on aircrafts and (ii) satellite archives (Landsat program), which gave us a larger view over space and time.
Field data from both samples and aerial images showed that trees at both sites were under stress, but the stress was higher at the site with lower groundwater connection. The temperatures of the individual tree were also higher at this site. This relationship was also tested at the forest scale using airborne campaigns acquired for four different years.
Satellite data helped us locate the areas of the forest that were impacted by a major past drought and to monitor their recovery, proving useful for identifying long-term trends.
Thermal infrared data shows promising results for detecting and mapping tree water stress in alluvial forests. However, a single thermal image alone is not enough to diagnose stress. It is necessary to also have complementary field measurements of the tree’s health state.
Keywords: drought ; multi-method approach ; riparian vegetation ; thermal infrared remote sensing ; water stress
I. Introduction
Vegetation on river banks and their surroundings, also called riparian vegetation, is strongly dependent on the water supply from the river. In periods of drought the water scarcity can strongly impact this riparian vegetation and its ecosystem. This is the case of alluvial forests, forests that are settled on river banks. These alluvial forests bring many benefits; they host important biodiversity, they improve water quality of the river and of the groundwater, and they also shape the river. It is therefore important to monitor their health.
Alluvial forests’ health has been strongly impacted by human development in the 20th century – through gravel mining, dam construction and other construction projects that have induced changes in the water flow and river banks, deteriorating the habitats and the ecosystems that rely on it. Today, these forests face additional threats from climate change: changes in precipitations induces a modified waterflow, impacting the water availability for trees. In addition, the rise of air temperatures amplifies this phenomenon and affects tree water use. In particular, the groundwater level decreases due to these important changes in water flow induced by climate change, which is exacerbated by human activities (water overconsumption, irrigation, drainage for construction, …). This contributes to threatening the health of the alluvial forests, with higher risks of mortality and long-term shifts in ecological successions, inducing the replacement of species that characterize alluvial forests.
Monitoring the response of alluvial forests to fluctuations in water availability will help understand the underlying processes and target conservation and restoration actions.
There exist many methods to assess the water stress status of individual trees, such as reading tree rings and sampling tree leaves for laboratory studies. In this study, Leaf Water Potenial (LWP) is used to measure how much water the tree can access and intrinsic Water Use Efficiency (iWUE) is used to estimate the capacity of a plant to use water to produce carbon. However, a major limitation of these approaches is that they are time-consuming and difficult to apply on a large scale such as multiple hectares of alluvial forests.
Using satellite or airborne sensors offers a way to monitor forests over broader spatial scales and longer periods by capturing images with temperature information. These images are called TIR-images (for Thermal InfraRed images). TIR gives a temperature value to infrared wave-lengths. Some post-processing makes it possible to visualize the spatial distribution of canopy temperatures, using a panel of colours.
It is useful to have information about the canopy temperatures because they are a good indicator of differences in water stress in alluvial forests. Trees use water to cool themselves so there are differences in temperature between trees that have access to water and trees that don’t. This means that TIR-images of the canopy temperatures can help to identify which areas have more or less access to water, which highly depends on the alluvial forest distance to the water table and therefore inform about its water stress status.
To sum up, the aim of this study is to combine laboratory analysis of sampled leaves and bark with TIR images in order to better assess the alluvial forests’ health at larger spatial scales. This will eventually help to implement conservation and restoration actions so as to protect the ecological benefits of alluvial forests.
The present paper explores in detail the combined use of leaves sampling and of TIR-imagery of alluvial forests from satellites and aircrafts. In order to test its efficiency and accuracy to provide the water stress status of the alluvial forests, several works have been accomplished:
- We tested if TIR information was a good measure of water stress by comparing tree canopy temperature with laboratory analysis of sampled leaves and bark;
- We tested the response and sensitivity to drought of the forest using existing TIR acquired for four different years by testing for a rise in canopy temperature based on groundwater connectivity
- We replicated a similar analysis using satellite data in order to identify patterns and changes over a longer time scale.
II. Materials and methods
1. Study site
The study focuses on the alluvial forest surrounding the Ain River, one of the main tributaries of the upper Rhône River in France. This large, meandering gravel-bed river has experienced substantial human modification.
During the 20th century, a series of dams were constructed along its course. These structures stop the sediment from flowing downstream and lower the river bed. This process of preventing the sediments to flow along a river is referred to as sediment deficit or sediment starvation. The sediment starvation on the Ain River gradually extends downstream by roughly 500 meters per year, resulting in channel incision, which deepens the riverbed about 1 to 2 meters; and lowers the water table.
This study focuses on a 50-kilometer-long section located downstream of this dam chain, extending to the confluence with the Rhône River, commonly known as the lower Ain River valley (Figure 1). Four river segments were selected for the study, referred to as river reaches.
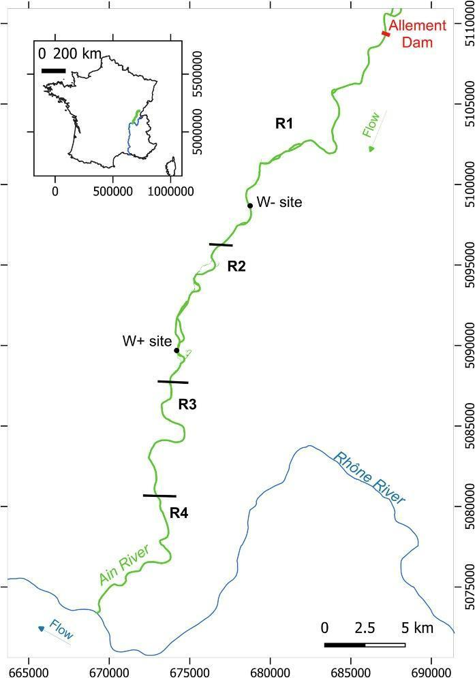
The uppermost reach (R1) of this section is strongly affected by sediment starvation and channel deepening caused by the upstream dams. Further downstream, the R2 reach exhibits a more stable riverbed, where the meandering processes tend to ameliorate the recovery of riparian forests. In contrast, the R3 reach experiences renewed sediment scarcity due to both the trapping of sediments within R2 and the limited local sediment supply constrained by morainic deposits (glacially derived sediment and rock accumulations) along the valley margins. Finally, the lowermost reach (R4), which connects to the Rhône River, was historically subject to regressive incision from the Rhône (i.e., channel deepening that propagates upstream), but in recent years it has shown signs of aggradation (i.e., the opposite of channel deepening) driven by renewed channel mobility and sediment production.
Field surveys conducted by the French National Forestry Office (ONF) in 2008 and 2017 identified black poplar as the dominant species within the alluvial forest. However, these surveys also revealed that sediment starvation and channel incision have negatively affected forest health along the Ain River, leading to a decline in native species such as black poplar, white willow and bitter willow. These species are increasingly being replaced by invasive (Japanese knotweed) and post-pioneer (European ash) species. The surveys also reported high mortality rates of poplar trees near the Rhône confluence, attributed to drought events that occurred in the early 2000s.
The overall degradation of riparian forest health is also visible in remote sensing data. A downward trend in NDVI (Normalized Difference Vegetation Index), an indicator of vegetation greenness and health derived from red and near-infrared reflectance confirms the decline in vegetation health. In addition, a combined analysis of ONF field surveys with LiDAR (Light Detection and Ranging, used to measure surface elevation and trees height) and hyperspectral imagery (high-resolution spectral data) showed a difference, between R1 and R2, in the forest distance to the water table, creating drier local conditions.
For these reasons, the Ain River represents an ideal natural laboratory to investigate water stress in riparian forests. Documented variations in species composition, vegetation structure, and spectral reflectance within the visible and near-infrared (NIR) suggest that seasonal water stress occurs during the growing period of vegetation and that some black poplar stands may have already adapted or responded to these drier environments.
2. Forestry Data Used for Field Validation
Fieldwork was conducted approximately every 2 weeks between 5 May and 27 September 2022 on two sampling sites: a site where poplar trees were assumed to be well connected to the river system (W+) and a site where poplars were assumed to be disconnected from the river and to have more limited access to groundwater (W−). For each site, 10 poplar trees were selected, and their diameter at breast height was measured.
2.1. Leaf Water Potential (LWP)
Two young leaf shoots were collected from each tree and kept cool and dark until tested in the lab with a pressure chamber. This measure, called leaf water potential (LWP), shows how much water the tree can access, lower values mean greater stress. In black poplars, values below about −1.75 MPa indicate the tree is closing its pores to conserve water during drought.
2.2. Phloem Collection and iWUE Calculation
iWUE is the “intrinsic water use efficiency” used to estimate the capacity of a plant to use water to produce carbon. If the quantity of carbon is higher for the same amount of water, the iWUE values will increase.
To estimate the iWUE, a part of the tree’s bark called the phloem, that transports sugar made in the leaf to the other parts of the tree, was sampled in a one on two field campaign. During drought, the quantity of water decreases and the plant tries to produce the same quantity of carbon so the iWUE values are expected to increase.
3. Remote Sensing Data
Images in the TIR (Thermal Infrared) spectrum were acquired in summer over four campaigns since 2010 with sensors mounted on an ultralight aircraft or a helicopter. Three different sensors were used. These sensors can detect temperature differences of around 0.1°C within an image. “Landsat” satellites were also used as a source of historical TIR data starting from 1990. Image selection was made by filtering for dry meteorological conditions.
4. Additional Information for Geo-Referencing, Selecting and Characterizing the Study Area
Historical aerial photographs were used to provide information about tree presence for dates close to the TIR campaigns. Aerial colour images were also acquired during the 2022 campaign by mounting a camera on the aircraft during the TIR acquisition.
Topo-bathymetric LiDAR data (topographic and water depth data) were acquired during August 2015 and covers the upstream half of the study reach (≈20 km), initially to study the form of the riverbed. It is used in this study to help assess the changes in canopy temperature based on forest distance to the water table for which a breakpoint of 2.5m was chosen based on previous studies on the Ain River.
Vegetation surveys, conducted by National Forestry Office (ONF) in 2007 and 2017, led to the survey of ~1200 forest plots in the study reach, with the goal of providing information on species distribution and health in the riparian forest of the Ain River.
These vegetation plots were used to provide an analysis grid common to the forest surveys and to previous studies that covers the lower Ain River corridor. That analysis grid is used for selecting new forest patches within which TIR information is analysed using the aerial and satellite images.
5. General Workflow
Data analysis first focused on the campaign conducted during summer 2022 to investigate how the water status of poplars differed between the two study sites. Water status was assessed by monitoring changes in LWP and iWUE from field samples. Differences in LWP or iWUE between poplars, between sites and between each week were then assessed by statistical tests. Meteorological data from the start of the campaign to its end were then plotted to recontextualise the observed trends in water stress with the trends in air temperature and precipitation of summer 2022.
TIR data from 2022 were then analysed by first looking at differences in tree crown temperature between poplars from the two sites. The crown shape is defined first, this shape is then used as a mask to extract temperature from the TIR imagery, and finally, the height obtained via LiDAR is associated with each record. Median temperature was then extracted for each tree crown from TIR data. Differences between the poplars on the two sites were then assessed using the same statistical tests as for LWP and iWUE.
Tree diameter from the field survey and tree height from the LiDAR data were tested to predict LWP, iWUE and TIR as potential variables to explain differences between poplars on a given site.
Data analysis then focused on using existing airborne TIR imagery to detect water stress and map the sensitivity of the riparian forest to drought at larger spatial scales.
In order to make sure the measured temperatures correspond to forest plots, the aerial images available near each campaign were used to screen forest plots and mask areas that were not vegetated.
The campaign from 2022 was used as a control of the expected response in temperature canopy under known stress conditions, and hydrological and meteorological data for the week before the campaign were plotted to contextualize the observations.
Maps of riparian forest sensitivity to drought were then produced using relevant campaigns. In order for maps to be comparable despite differences in atmospheric conditions at the time of survey, canopy temperature values were plotted according to their statistical distribution. Similar maps were then created using “Landsat” data to highlight lasting changes since 1990.
III. Results
1. Field validation of Tree Water Stress and TIR Response
During summer, the drought condition seems to change since we can observe variations in the water status of each tree (Figure 2). But in each study site, the LWP value went too low to consider the trees as not stressed (i.e., lower than −1.75 MPa, the threshold where black poplars close their pores to conserve water during drought).
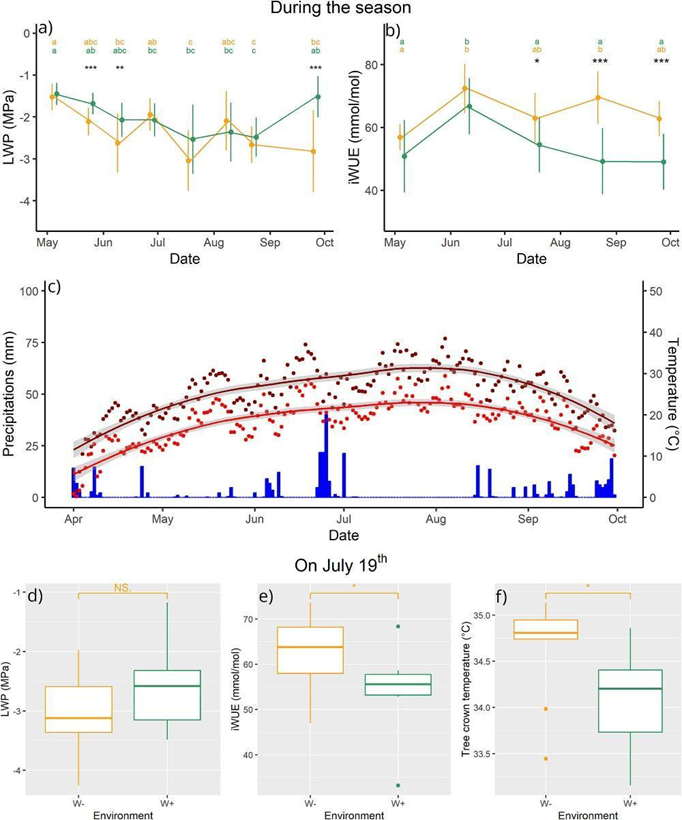
LWP values dropped during summer and were lower than the stress threshold for trees in both sites. In the connected site (W+), LWP values were higher throughout the season than in the disconnected site (W-). Recovery towards initial LWP values was observed in October for the connected site but not the disconnected site.
Concerning the iWUE measurements, the results are showing the same pattern as for the LWP, even if the measurements were not repeated as often as for the LWP. iWUE values were lower for the connected site than the disconnected site throughout summer. While iWUE stayed increased from June to October in the disconnected site, trees started recovering at the end of July in the connected site. Globally, the two indicators are showing an increasing stress during summer and a recovery starting at the end of August and September when the rainfall starts. At the time of the TIR acquisition, the LWP value was lower in the disconnected site (W-) than in the connected (W+) site. Tree temperature was also higher in the disconnected site (W-) than in the connected site (W+), suggesting a greater water stress for this area.
2. Inter-annual Differences in Airborne TIR Response to Summer Conditions
The goal was first to show whether forest water stress can be seen at a larger scale (using forest plots instead of individual trees). As there wasn’t any field data associated with historical images, this study was based only on the thermal response of the vegetation to changes in groundwater connectivity. From previous studies, a breaking point of 2.5 meters above the water table was used to distinguish between connected and disconnected forest plots (Figure 3).
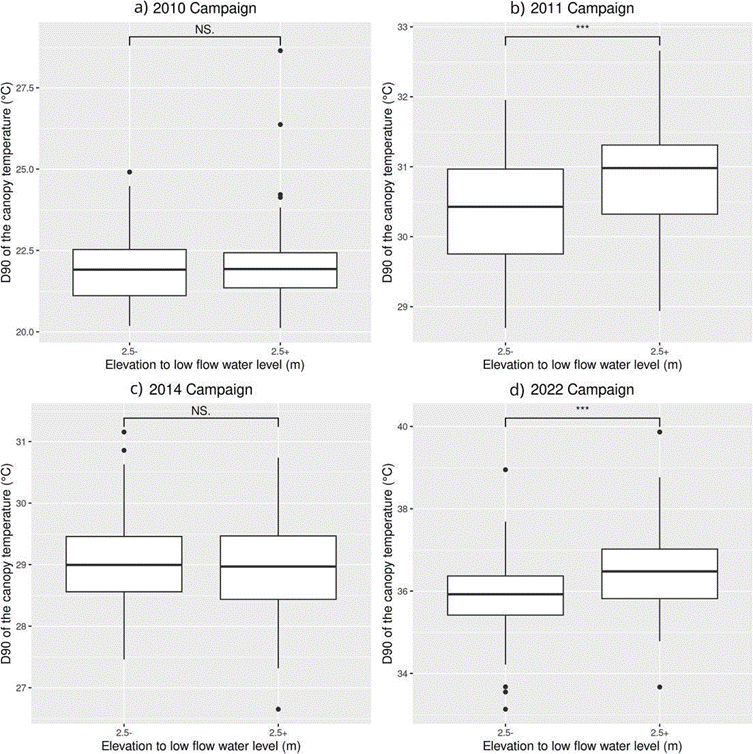
In 2022, the results showed that trees that were more distant to the water table were more impacted by the drought, showing temperatures similar to the highest one in the disconnected sites. This is the same as what was observed between the connected (W+) and disconnected (W-) sites at the tree scale. In 2011 the results were globally showing the same pattern but no responses were seen in the two other years.
3. Mapping of Airborne TIR Responses to Summer Droughts: 2011 vs 2022
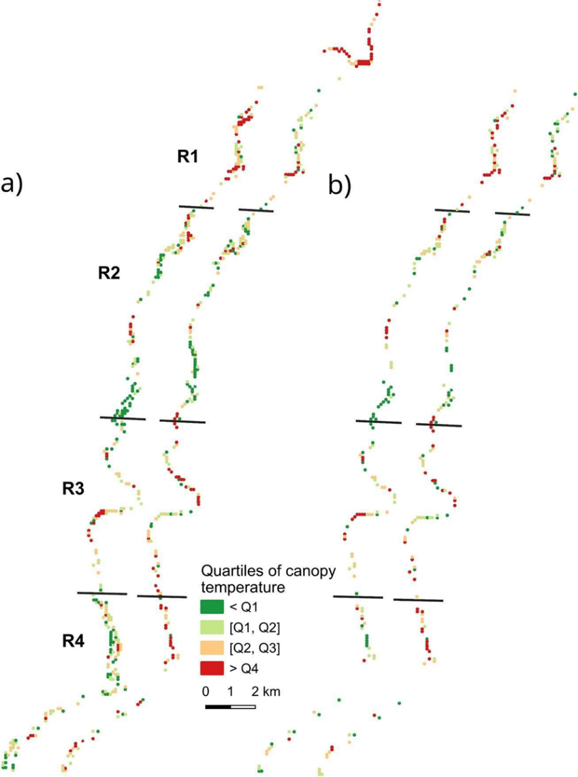
The airborne thermal acquisitions resulted in two maps of the whole forest used to determine which part of the forest is the most vulnerable to droughts (Figure 4). Both of them are covering most of the forest near the river section (the area created by the meandering of the river isn’t well covered). The higher temperatures were seen in the R1 and R3 reaches and the lower temperatures in the R2 and R4 reaches. R2 is considered the most geomorphologically stable reach and R1 the most degraded one. This shows that the thermal response is influenced by the geomorphological changes that occurred in the 20th century. Finally, changes in the spatial patterns of canopy temperatures between 2011 and 2022 shows that a partial recovery occurred in R1 and that conditions in R4 degraded.
4. Mapping Large-Scale Riparian Thermal Changes Using “Landsat” Archives
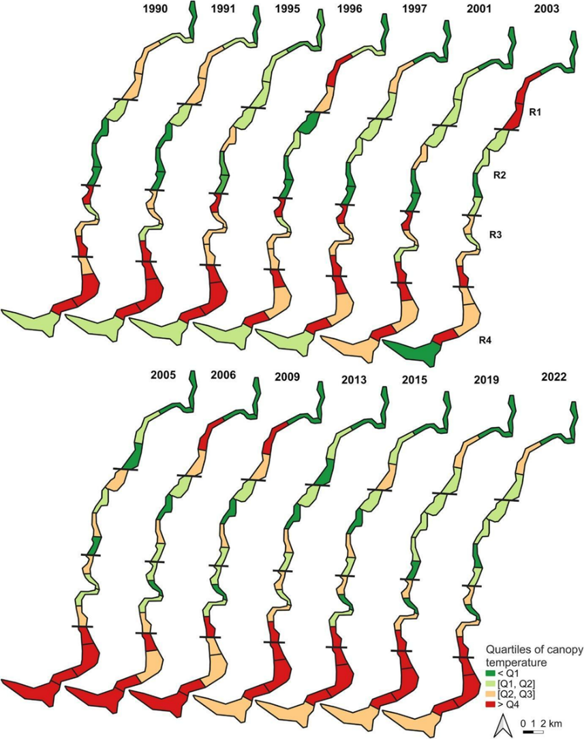
Selecting images for the analysis was complex as the criteria for a fitting image were not always here. It was necessary to have images after several days without rain and also without cloud cover. This resulted in a selection of 14 images for a 32-year study period.
Also, the imagery used comes from “Landsat” imagery which is way less precise than airborne imagery (100m compared to 0.35 to 1.5 m precision) when you work on small reaches. But even with those problems, we can see similar patterns of temperature distribution between the reaches each year (Figure 5). This shows that the vulnerability of a forest doesn’t depend on the annual weather only. And it is also important to know that when really harsh events happen like the drought of 2003, the forest can take a lot of time to show signs of recovery. As of today, only one of the banks is showing these signs.
IV. Discussion and conclusion
1. Summer Water Stress Conditions of Poplar Trees Depend on Water Accessibility
The results show that the amount of water available to poplar trees has a strong influence on how stressed they become in summer. We measured this using several indicators such as leaf water potential (LWP), tree crown temperature, and intrinsic water-use efficiency (iWUE). Trees growing in drier places were clearly more stressed than those in wetter ones, however, even trees located in areas with better water access experienced some level of stress during the summer of 2022. This means that droughts can affect all riverbank forests, even those that normally have good access to water.
Satellite images also revealed long-term changes in the forest near the point where the Ain River meets the Rhône River. These changes started after the extremely hot and dry summer of 2003, when many trees died. This was confirmed by field surveys that reported a higher number of dead poplars after that drought.
Even though this was the response that was observed on the Ain River, when trees lack water, they can react in different ways. Some may die or lose many leaves, while others simply grow more slowly or produce smaller leaves. Some trees that come from drier regions, such as poplars from Spain, are naturally better adapted because they grow more slowly and close their leaf pores faster to save water.
In our study, the relationship between tree height, the trunk diameter, and water stress showed some interesting patterns. Larger trees in the drier areas were more stressed at the beginning of the summer but recovered differently compared to those in wetter areas.
Overall, the way water availability affects trees is complex. We showed that it depends both on river processes, like groundwater levels and flow, and on weather conditions such as rainfall. However, not all tree species have the same type of roots, so some can reach deeper water than others. Forest responses may vary depending on their composition.
2. The Benefits of a Multi-Tool Approach to Understand Tree Response to Water Stress
We used several methods to understand how trees respond to water stress. These included field measurements and thermal infrared (TIR) images taken from the air.
Each tool helped us see part of the situation, but none of them could show the whole picture alone. One year we had both LWP, iWUE and Thermal indicators which worked well to detect stress during the summer. However, the three other years of the study we only had TIR data that showed differences between sites but did not confirm whether the trees were physiologically stressed.
Different indicators react at different speeds and to different factors. That is why using several tools together gives a better understanding of how trees react to water stress. For example, when trees close their stomata, which are tiny openings on the leaves, they lose less water, but their leaves become warmer. Even after rain, these stomata do not reopen immediately, so the trees may still appear stressed for a while.
Combining measurements of the temperature, the colour, the topography and tree structure by using thermal, optical and Lidar sensors, could help us understand how riverbank trees react to drought and how quickly they recover.
3. Good Practices in Designing Campaigns to Monitor Water Stress in Riparian Ecosystems
To study or monitor water stress in large river ecosystems, it is best to combine TIR data with field measurements and optical imagery. Using multiple indicators for water stress makes it easier to confirm observations and to know exactly when and where stress occurs.
Data collection should be carefully planned. Measurements need to be made when stress is expected to be strongest, usually during the hottest part of summer. It is also better to avoid collecting data just after rainfall, since recent rain can hide signs of stress. Having several observations over the same summer is also recommended.
Using drones or satellites can make this kind of monitoring easier and cheaper than using helicopters or airplanes. Drones can take detailed pictures more often, but they can only cover small areas. Satellites can cover much larger areas, but their images are really coarse and can provide error due to the resampling.
A combination of both methods could work best. Drones can provide detailed local data that can be used to improve or check satellite observations. This can also help scientists decide when it is most useful to carry out larger and more expensive aerial surveys.
4. Production of Spatially Explicit Knowledge for Stakeholders and River Management
This study confirms that the riparian forest along the Ain River experiences water stress during summer. Even the parts of the forest that seemed well connected to water sources showed signs of stress during the 2022 drought.
We also found that areas affected by riverbed deepening, which lowers the water table, suffer more from water stress. Trees in these areas were stressed earlier and more strongly than those in places with better river conditions.
These findings are important for people who manage and protect river ecosystems. For example, the part of the forest near the Rhône River was more affected by the 2003 drought because of reduced access to water. Current management actions, such as adding gravel to improve the riverbed, mostly focus on other parts of the river. However, our results suggest that similar actions should also be taken closer to the Rhône to help trees such as Populus nigra survive future droughts.
If a new dam is built on the Rhône River, it could make water stress even worse for these forests. Stakeholders should consider this carefully to protect pioneer tree species and to prevent the forest from turning into a drier and less diverse ecosystem.
How to cite this article : Julien Godfroy, Poorva Bhatt, Helen Cadoret, Amirreza Ghannad, Gloria Tshitoko, Mathis Vignaud, Bastien Lequay and Jan Doleiska From IWS master (Villeurbanne, FR), How to identify and monitor the response of forests near riverbanks to drought: use of aerial thermal imagery and on-field measurements, Journal DECODER, 2026-07-02